Fielding Homes

The American Dream
Fielding Homes, and its parent, Crescent Communities, approached us looking for a thoughtful and engaging piece of collateral for their consumers. More than just a development company, Crescent is a leader in the real estate space, and they wanted to bring to life research on how the American family home, a cornerstone of our national story, has evolved over the decades. Taping into the nostalgia of the design and aesthetic from the end of World War II to today, we created an interactive infographic that emphasized illustration to communicate the evolution of the American Dream.
Involvement: Concept, Art Direction, Illustration
Seven Decades of Housing Trends
Have you ever wondered when homes will be as big as the lots they stand on?
Or how much square footage is “too much” per person?
We explore this and more as we look at changes to the American home through the past seven decades.

1950’s
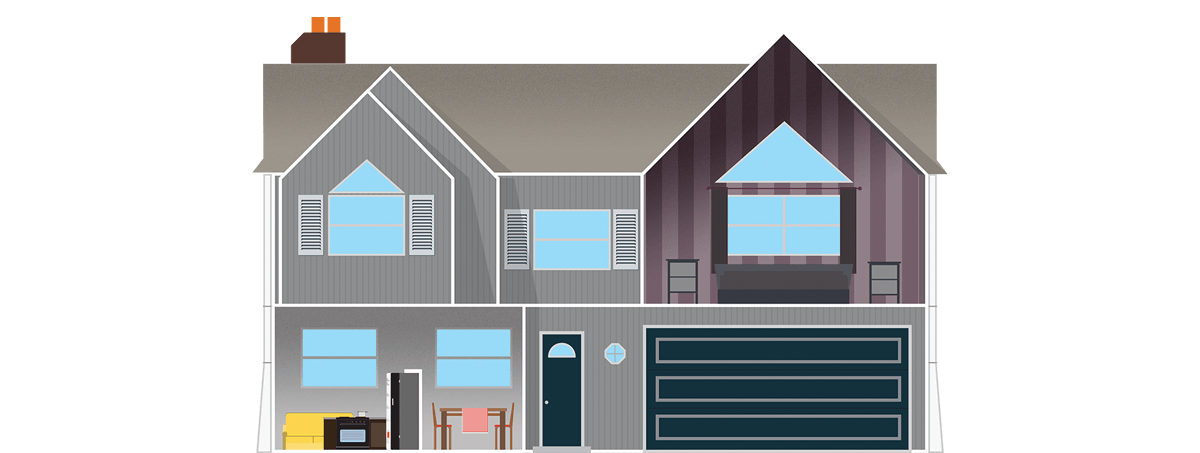
The simple design of minimal traditional homes was appropriate for a country recovering from the Second World War.
These compact homes had more shower space than sleep space, averaging 1.5 bedrooms and 2.35 bathrooms per home.
These were the years of pastels, with canary yellow and petal pink as the most popular appliance colors.

1970’s
Late modernist homes combined the style of the '60s while moving back toward the simple ranch aesthetic that would continue for decades onward.
One of the most iconic color combinations in American homes, avocado and harvest gold, brought a bright pop of color to the appliances of the '70s.
While the average home gained an extra bedroom from the decade prior (3), the bathroom average remained around 1.8 per home.

1990’s
Houses grew more in size than in style in the 1990s, opting for higher ceilings and two-car garages that dominated the façade.
A more muted color scheme was apparent in '90s styling, with black as the top color of appliances.
Though the square feet per person increased by 21% compared to the 1980s, the average number of bedrooms and bathrooms remained the same per home, 3 and 2, respectively.

1960’s
This decade’s homes captured the spirit of mid-century modernism,
a style that added sleek, futuristic touches that became iconic of the decade.
As home size began to grow, the bedroom and bathroom ratio flipped from the previous decade, with an average of 2.5 bedrooms and 1.5 bathrooms per home.
Adding a high contrast of neutral and neon, the '60s
saw turquoise and coppertone as its appliance colors of choice.

1980’s
Though the average number of bedrooms remained the same from the decade before, 3 per home, houses began to add more bathrooms to accommodate their occupants, averaging 2 per home.
Tapering back the bold choices of the past decade, the '80s began to incorporate more neutrals into the appliance color schemes with almond and beige.
The split-level ranch added an extra floor (or two) to the simplistic design of the ranch homes of prior years.

2000’s
Home sizes remained relatively stagnant from the 1990s to the early 2000s, growing less than 10% and averaging 3.34 bedrooms and 2.37 bathrooms per home.
Northwest contemporary homes began to incorporate more natural elements into their construction, including wood and brick, after being influenced by the international design movement.
The new millennium brought a futuristic feel into our homes with stainless steel appliances.

2010’s
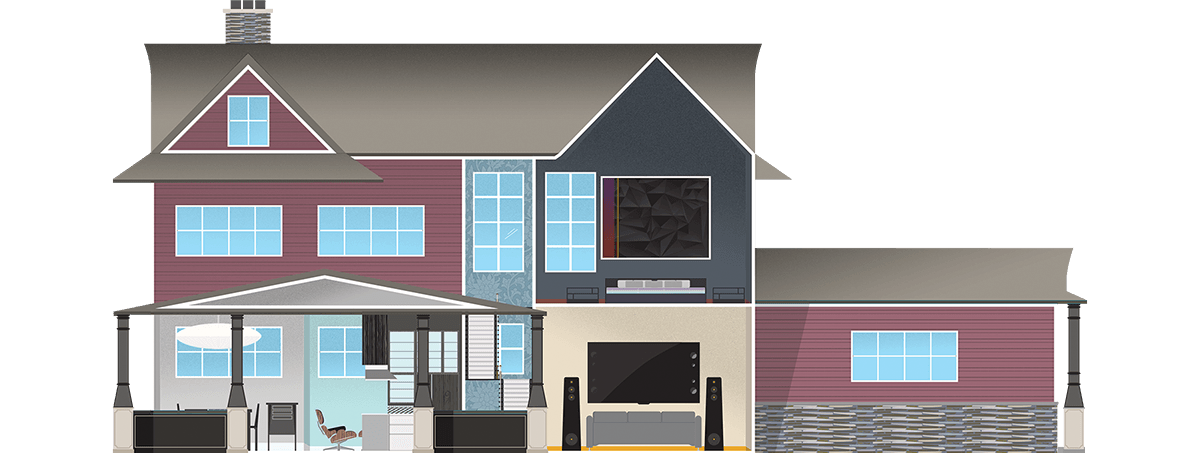
As houses continue to grow and lot sizes stay the same, architecture has continued to build upwards, with more floors and higher ceilings. Environmental considerations and the small house movement have also added features for more eco-friendly living.
Room counts of bedrooms and bathrooms remained consistent into the second decade of the new millennium, with a personal living space increase of 9%.
Minimalism is the new style, opting out of bold color choices and adding in façades to help appliances seamlessly blend in with the kitchen décor around them.
With more and more convenient ways to enjoy at-home entertainment, many homeowners have increased the size of their screens as well as the number of televisions on their walls (averaging 3 per home).
Thoughts
Lot size is relatively stable, while homes continue to grow. What is the tipping point?
House size is growing, while the number of people per household is shrinking. Will these data points reverse course?
Over the past decades, people are in vesting a higher and higher percentage of their income in their home. What is the peak?

